Spider Sense

Feel what moves on the web.
Spider Sense is an APM for the local development loop. One jar, one JVM option, and a browser tab that shows every request, every SQL statement, every error and the JVM’s vital signs of the application you are working on, a second after they happen.
It is a sibling of Spider Silk, the web framework its UI is built with, and it follows the same idea: thin by design. Silk is the web a spider builds, and Sense is what the spider feels through it, the tingle when something on the web moves. The product tells you that something is slow or broken before you go looking.
Three ideas
- A Glowroot-style deployment, OpenTelemetry data.
-
-javaagent:spider-sense.jaris all it takes, like Glowroot. Unlike Glowroot, the instrumentation is the stock OpenTelemetry Java agent, and the collector speaks OTLP/HTTP. Anything that emits OpenTelemetry can send to it. - Nothing to install, and the data outlives the application.
-
There is no Docker, no account, and no server to run. What it collects goes into an H2 file under
~/db/spider-sense/, sojava -jar spider-sense.jaropens the same screens on the same data after the application has stopped or crashed. Rows older than a day are swept. - Built for the questions you ask while coding.
-
Which endpoint is slow, which query made it slow, what a request did step by step, what threw, and what the log said at that moment.
Influences
Every screen in Spider Sense comes from a product that got it right first.
| Product | What Spider Sense takes from it |
|---|---|
The deployment model: one jar, |
|
The scatter, which Scouter calls the XLog: every request is a dot on a time by response-time scatter, errors in red, and a drag over a cluster of dots lists those traces. The profile view of one transaction as a step list with elapsed and gap times. The habit of keeping the last N minutes always visible. |
|
The server map: services, databases and external hosts as nodes, calls as edges, a node click opening that node’s numbers. The response summary (requests bucketed by response time, errors apart) and the load chart stacked by the same buckets, with Apdex as the one-number health score. The success and failed filter and the heatmap alternative on the scatter. The call tree’s self time and percentage per step. The inspector’s data-source panel (connection pool used, idle, max and pending). |
|
The OpenTelemetry-native data model: services derived from |
|
Single binary, no external dependencies, everything on one port, a query bar above every list, and a one-line "how to send data here" snippet in the UI. |
What you see
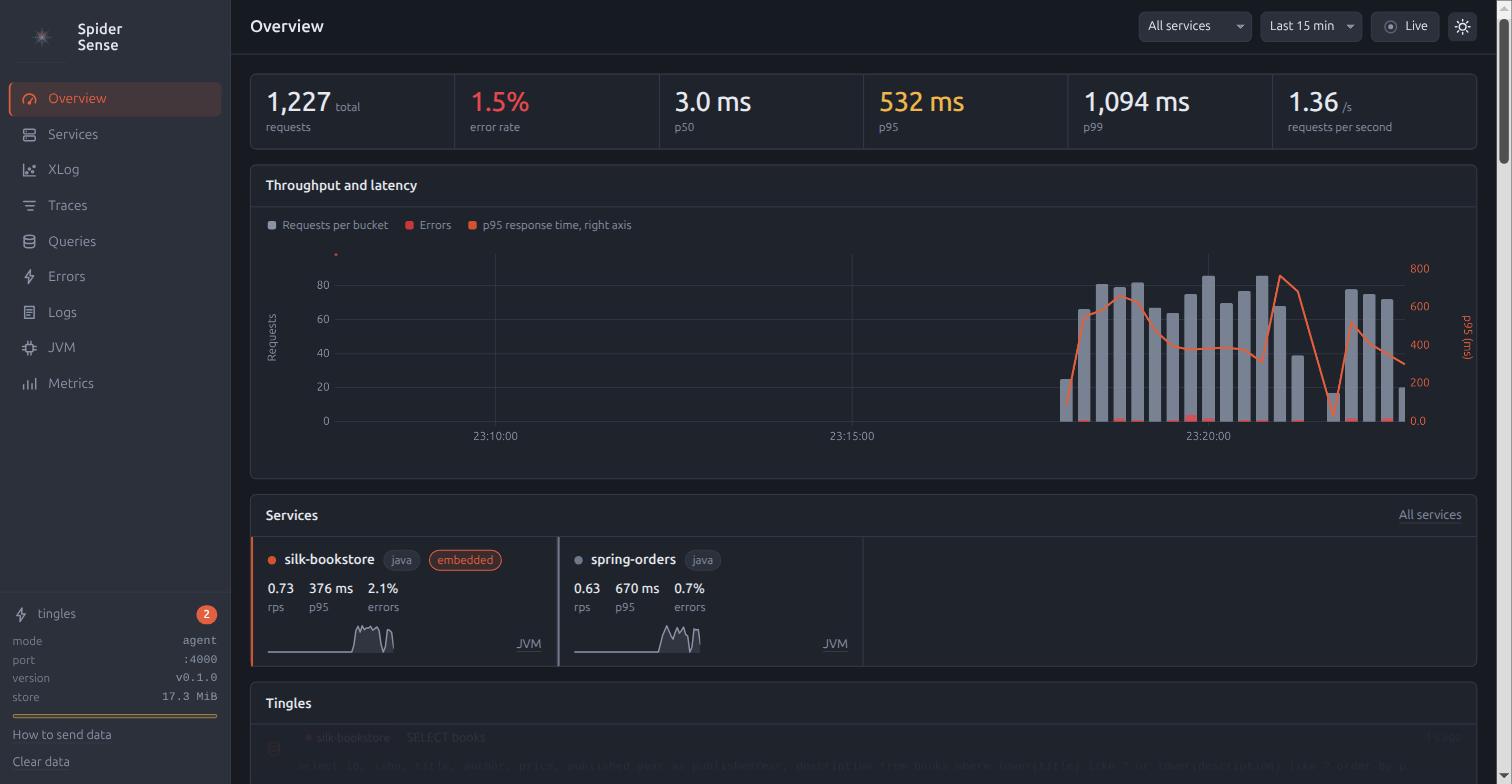
| Page | What it answers |
|---|---|
Is anything wrong right now: request rate, Apdex, error rate, p95, requests by response-time bucket, and the feed of tingles (slow requests, slow queries, errors) as they happen. |
|
A Pinpoint-style server map: services, databases and external hosts as nodes, calls as edges. Click a node for its response summary. |
|
Which route costs the most: calls, rps, Apdex, p50, p95, p99, errors, status codes, and the queries and errors behind it. |
|
A Scouter- and Pinpoint-style scatter: every request as a dot on time by response time, or as a heatmap. Drag over a cluster to see those traces. |
|
The list, the waterfall, a span drawer with every attribute and stack trace, and a Scouter-style profile view: what the request did, step by step, with gap and self times. |
|
SQL statements grouped as the agent sanitised them: calls, avg, p95, max, total time, and who calls them. |
|
Exceptions grouped by type and message, with a sample stack trace and the traces they occurred in. |
|
The application’s log records with trace ids, so a trace and its log lines are one click apart. |
|
Heap, GC, threads, CPU, classes and connection pools from the agent’s metrics, and an explorer for every other metric. |
Layout and Controls describes the frame around those pages: the sidebar, the time range, the service filter, Live, and the marks drawn on every chart.
For AI agents
The same jar is a command line, and its answers are made for an agent’s loop: change the code, run, hit a few endpoints, read what to fix, check that the fix held.
java -jar spider-sense.jar mark before                     # name the moment
# exercise the endpoints, or run the tests
java -jar spider-sense.jar findings --since=before          # ranked: N+1, slow queries, slow endpoints, errors, exhausted pools
java -jar spider-sense.jar trace 4bf92f3577b34da6a3ce929d0e0e4736   # one request as a tree, repeats collapsed
# fix, restart
java -jar spider-sense.jar compare --before=before --after=start     # the same endpoints and queries, side by side
java -jar spider-sense.jar check --max-queries-per-request=10       # exit code 0 or 1
Every command prints Markdown, takes --json for the JSON, and asks the running Spider Sense over HTTP.
It reads the H2 file directly when none is running, so it still answers after the application has crashed.
An agent skill teaches an agent the whole loop, and java -jar spider-sense.jar init installs it into a project.
Quick Start for Agents is the short way in: install the skill, choose the CLI or MCP, and what to ask.
The same answers are also an MCP server, for a host that has no shell.
The Loop is where to start.
The examples
Two deliberately misbehaving applications and a load generator come with the repository, so there is something to look at before there is anything of your own: silk-bookstore is a Spider Silk application over spring-jdbc and H2 with a full-scan search, an N+1 page and an endpoint that fails at random, spring-orders is a Spring Boot application over Spring Data JPA that calls the bookstore over HTTP so one trace spans two services, and load-gen drives both at a few requests per second.
scripts/demo.sh starts all three, and The Examples says what each one does wrong.
Where to go next
Installation gets the jar, from Maven Central or from a checkout. The Three Modes explains agent, forwarding and standalone, and which one a given setup wants. Configuration lists every property. The Loop is the same product from an AI agent’s side.
The repository holds the specifications the manual is written from, and the license is Apache-2.0.