Layout and Controls
The Spider Sense UI is one page in the browser, a sidebar of pages beside a top bar of controls that every page obeys.
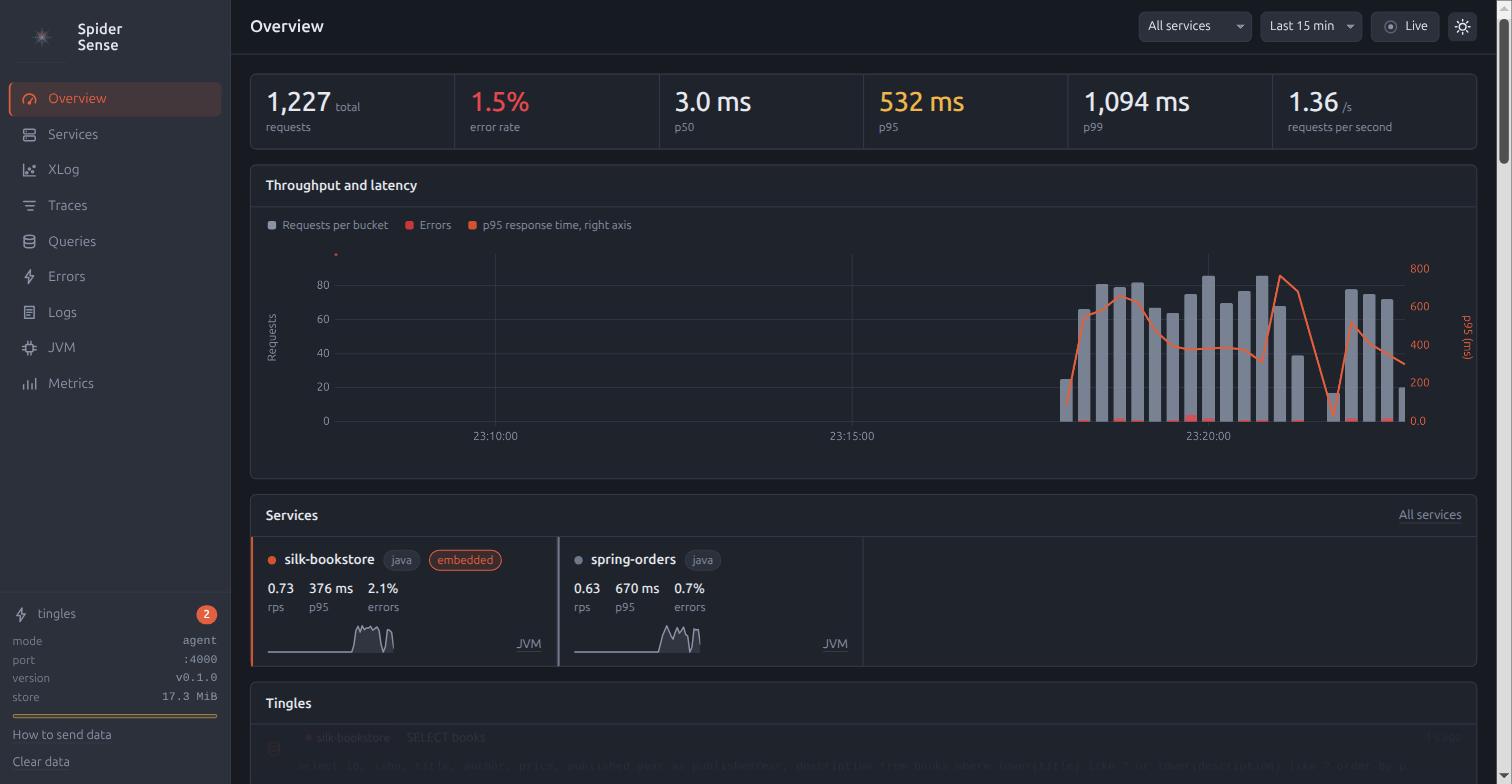
The look
The UI is dark by default, follows your system’s light or dark preference, and carries a toggle in the top bar that remembers your choice. The accent colour marks the primary actions, the active page in the sidebar, and what is slow. Each service keeps its own colour, so a service looks the same in every chart. Colour is never the only carrier of meaning: an error also gets a bolt, and something slow also gets a ring or a turtle.
Layout
The sidebar lists the pages: Overview, Findings, Compare, Map, Services, Scatter, Traces, Queries, Errors, Logs, JVM, and Metrics. On a narrow window it collapses to icons, and on a phone-sized one it becomes a drawer behind a menu button. The rest of the window is the page, under the top bar.
The sidebar foot shows the mode Spider Sense runs in, its port, its version, and a "how to send data" link that opens the snippet dialog.
When spans have been dropped, the foot adds a dropping spans line in amber, with the number dropped as its title.
That happens when the traffic crossed spidersense.ingest.max-spans-per-second, and the line stays for a minute after the last increase, so a load test reads as partial data rather than as a quiet application.
The top bar
The top bar carries the page title on the left, and on the right the Mark button, the service filter, the time range, and the Live toggle.
- Mark
-
Opens a small dialog with a name, an optional note, and OK. The name takes letters, digits, dots, underscores and hyphens, up to 64 characters. It is prefilled with
beforewhen no mark in the window is namedbefore, and withafterotherwise. When the service filter names one service, the mark records that service. OK creates the mark and shows a toast naming it. Marking is your half of the loop an agent runs: mark, exercise, compare. Marks covers what a mark is and how the agent’s side reads it. - Service filter
-
All services, or one. It applies to every page that takes a service.
- Time range
-
5m,15m,1h,6h, orall.allstarts at the oldest span in storage. - Live
-
The page refreshes every few seconds, and the end of the window moves with the clock. A "spans/s" readout sits beside the toggle. Every tingle increments the badge on the sidebar and appears at the top of the Overview feed as it happens.
Marks on charts
Every time-series chart draws the marks that fall inside its window as a vertical dashed line the full height of the plot, with the name as a small label at the top.
The automatic start marks are grey, and every other mark is in the accent colour.
A mark that names a service is drawn only when the service filter is off or is that service.
The tingle badge
The sensing arcs of the logo in the sidebar pulse once when a tingle arrives, and the badge on the sidebar’s tingles entry counts up.
The pulse respects a reduced-motion preference.
Dialogs
- How to send data
-
Three tabs,
-javaagent, environment variables, andcurl. Each is a copyable block carrying the endpoint this Spider Sense actually listens on. - Clear data
-
Asks for confirmation, then deletes the stored data.