Spider Sense

Feel what moves on the web.
Spider Sense is an observability tool for the local development loop. One jar, one JVM option, and a browser tab that shows every request, every SQL statement, every error, every log line and the JVM’s vital signs of the application you are working on, a second after they happen. It takes the three OpenTelemetry signals, traces, metrics and logs, and answers with them what is slow, what failed and why, and what the application was doing at that moment.
It is a sibling of Spider Silk, the web framework its UI is built with, and it follows the same idea: thin by design. Silk is the web a spider builds, and Sense is what the spider feels through it, the tingle when something on the web moves. The product tells you that something is slow or broken before you go looking.
What it is for
- An AI coding agent fixes what it can see.
-
Spider Sense gives the agent the performance and error feedback a person would get from a dashboard, as text with numbers and trace ids, so an N+1 in a JPA repository or a query without an index is found and fixed in the agent’s own loop, before
git commitandgit push, not on the development server a week later. The Loop is that cycle: run under Spider Sense, exercise,findings, fix,compare,check. - A developer watches the application while writing it.
-
Every request, query, error, log line and the JVM’s vital signs of the application on the local machine, a second after they happen, so a slow endpoint or an exception is noticed and understood while the code is still open, rather than found later by someone else.
- The tests become a diagnosis.
-
A test run under Spider Sense leaves the same traces, queries, errors and logs as a request from a browser, so
findingssays what the code the tests exercised did wrong, andcheckturns that into a build failure. It is the fastest feedback there is, for the agent and the person alike: one./gradlew test, and the N+1 is named with its statement and its line before anyone opens a browser. The Gradle Plugin and Maven show the one-line setup that forwards a test JVM to a standalone Spider Sense. - The OpenTelemetry setup is checked before it ships.
-
Metrics, traces and logs arrive here exactly as they would at the real backend, so a custom meter, a span attribute, a service name or a Spring Boot Actuator metric is confirmed to be collected and aggregated as intended before the application is deployed to a development server.
Three ideas
- One option, OpenTelemetry data.
-
-javaagent:spider-sense.jaris all it takes: the UI is served from the monitored JVM. The instrumentation is the stock OpenTelemetry Java agent, and the collector speaks OTLP/HTTP. Anything that emits OpenTelemetry can send to it, and a Spring Boot application’s Actuator metrics arrive the same way. In standalone mode the same jar is a collector and dashboard for every other platform: a Node.js, Python, Go or .NET application with the OpenTelemetry SDK, or an OpenTelemetry Collector, sends over OTLP/HTTP withOTEL_EXPORTER_OTLP_ENDPOINTandOTEL_EXPORTER_OTLP_PROTOCOL=http/protobuf, and a Java application can send from the stockopentelemetry-javaagent.jar, or any OpenTelemetry-compatible agent, instead of the Spider Sense jar. - Nothing to install, and the data outlives the application.
-
There is no Docker, no account, and no server to run. What it collects goes into an H2 file under
~/db/spider-sense/, sojava -jar spider-sense.jaropens the same screens on the same data after the application has stopped or crashed. Rows older than a day are swept. - Built for the questions you ask while coding.
-
Which endpoint is slow, which query made it slow, what a request did step by step, what threw, and what the log said at that moment. The products the screens learned from are named in Design.
What you see
| Page | What it answers |
|---|---|
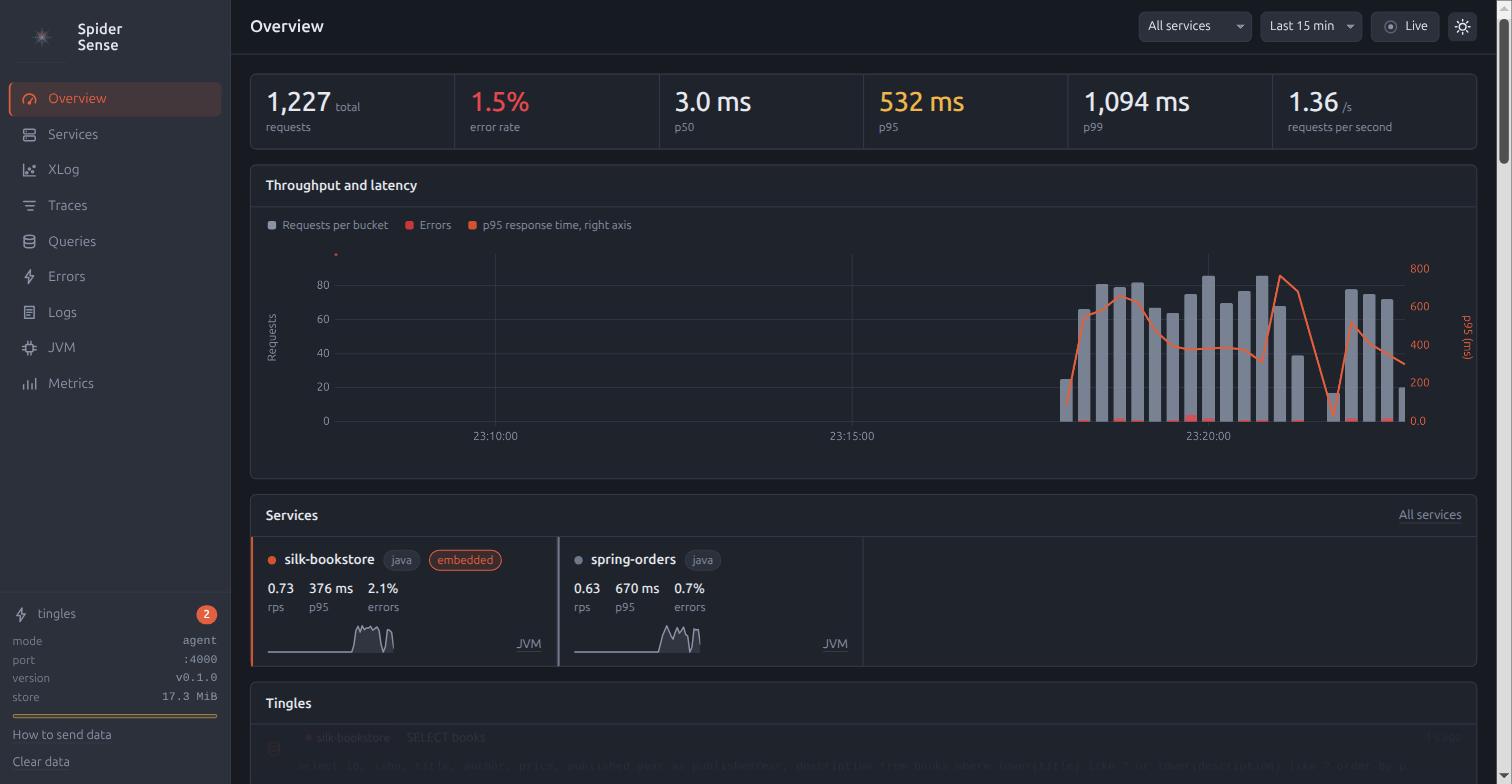
Is anything wrong right now: request rate, Apdex, error rate, p95, requests by response-time bucket, and the feed of tingles (slow requests, slow queries, errors) as they happen. |
|
A server map: services, databases and external hosts as nodes, calls as edges. Click a node for its response summary. |
|
Which route costs the most: calls, rps, Apdex, p50, p95, p99, errors, status codes, and the queries and errors behind it. |
|
Every request as a dot on time by response time, or as a heatmap. Drag over a cluster to see those traces. |
|
The list, the waterfall, a span drawer with every attribute and stack trace, and a profile view: what the request did, step by step, with gap and self times. |
|
SQL statements grouped as the agent sanitised them: calls, avg, p95, max, total time, and who calls them. |
|
Exceptions grouped by type and message, with a sample stack trace and the traces they occurred in. |
|
The application’s log records with trace ids, so a trace and its log lines are one click apart. |
|
Heap, GC, threads, CPU, classes and connection pools from the agent’s metrics, and an explorer for every other metric, Spring Boot Actuator’s included. |
Layout and Controls describes the frame around those pages: the sidebar, the time range, the service filter, Live, and the marks drawn on every chart.
For AI agents
The same jar is a command line, and its answers are made for an agent’s loop: change the code, run, hit a few endpoints, read what to fix, check that the fix held.
java -jar spider-sense.jar mark before                     # name the moment
# exercise the endpoints, or run the tests
java -jar spider-sense.jar findings --since=before          # ranked: N+1, slow queries, slow endpoints, errors, exhausted pools
java -jar spider-sense.jar trace 4bf92f3577b34da6a3ce929d0e0e4736   # one request as a tree, repeats collapsed
# fix, restart
java -jar spider-sense.jar compare --before=before --after=start     # the same endpoints and queries, side by side
java -jar spider-sense.jar check --max-queries-per-request=10       # exit code 0 or 1
Every command prints Markdown, takes --json for the JSON, and asks the running Spider Sense over HTTP.
It reads the H2 file directly when none is running, so it still answers after the application has crashed.
Two agent skills teach an agent the whole loop and, for a slow query or an N+1, the index to add, the rewrite or the fetch join, and java -jar spider-sense.jar init installs both into a project.
Quick Start for Agents is the short way in: install the skill, choose the CLI or MCP, and what to ask.
The same answers are also an MCP server, for a host that has no shell.
The Loop is where to start.
The examples
Four deliberately misbehaving applications and a load generator come with the repository, so there is something to look at before there is anything of your own: spring-orders is a Spring Boot application over Spring Data JPA with a slow report, a lazy-loading N+1 and a call to another service so one trace spans two, servlet-warehouse is the same kind of trouble on plain Servlets under embedded Tomcat, batch-worker has no web server and shows slow jobs, a pool that runs dry, log-only errors and a thread leak, silk-bookstore is a Spider Silk application over spring-jdbc and H2 with a full-scan search, an N+1 page and an endpoint that fails at random, and load-gen drives the web applications at a few requests per second.
scripts/demo-shared.sh starts all of them behind one Spider Sense, and The Examples says what each one does wrong and how to hand the demo to an AI agent.
A recording of that demo is published as a static page, so the screens can be seen before anything is installed.
Where to go next
Installation gets the jar, from Maven Central or from a checkout. The Three Modes explains agent, forwarding and standalone, and which one a given setup wants. Configuration lists every property. The Loop is the same product from an AI agent’s side.
The repository holds the specifications the manual is written from, and the license is Apache-2.0.